GIS steps beyond the perimeter of the map.
In this place where data and science meet, we bring order to chaos for the efficient, effective management of…well, just about anything. GIS is everywhere. On your wrist, in your pocket, behind nearly every map, app, report and news story out there today. But, GIS is so much more than the paper maps of yesteryear. Learn how it has evolved, where it’s headed and why it brings so much excitement to the daily lives of our MSA GIS team in this engaging 8-question roundtable discussion.

Q #1: When did you first discover GIS and/or what first attracted you to GIS?
Scott Kiley, GISP, Senior GIS Analyst: I discovered GIS in my third year of college. It was 1999. I had been studying traditional computer science, but didn’t feel fulfilled by it. I began searching for study options where I could incorporate my love for the environment. I was first exposed to GIS in an introductory landscape architecture class. We overlaid various GIS layers to determine best land use designations. It was a simple exercise, but the analysis of multiple datasets combined with mapping had me hooked. Coincidentally, Esri founder Jack Dangermond also started his career in Landscape Architecture!
Amber Converse, Senior GIS Analyst: I used GIS for a bit in graduate school, delineating large watersheds for water quality research. However, I truly became acquainted with the powers of GIS while working at the Alaska Energy Authority. I prepared maps and datasets of different energy production types across the state, specifically focused on the number of renewable energy options available to small, remote communities. My analytical brain was immediately smitten with the idea of using geographic information to drive decision-making and develop creative solutions to streamline workflows.
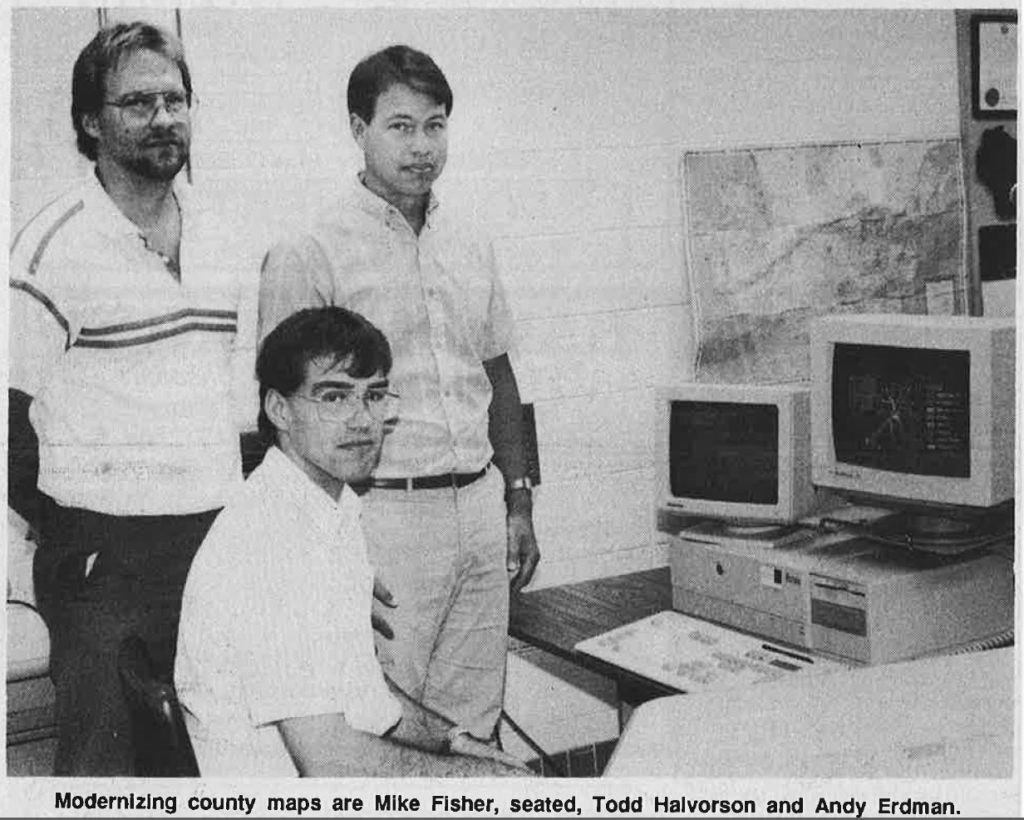
Todd Halvorson pictured upper left. Image courtesy of the Wisconsin Land Information Association.
Zach Svoboda, GIS Specialist: I originally went to school to be an urban planner, but quickly discovered the tool of GIS during my freshman year and decided to add GIS as a major. GIS attracted me because it provided a way to spatially interpret large-scale ideas.
Todd Halvorson, GISP, Senior GIS Administrator: I have always had a love of maps in general, going back to the National Geographic magazine subscriptions my grandmother gave to me as a gift. I also enjoyed drawing and calligraphy in my drafting classes in high school. In college, I ended up majoring in geography where I took my first cartography class about the time that the PC was gaining traction in society. UW-Whitewater offered Computer Mapping classes before they had GIS software, which was brand new at the time.
Courtney Rooyakkers, Senior Engineering Technician: About 20 years ago. Our original MSA GIS team was looking for help with a GIS addressing project and I was available to help. I’ve been using GIS ever since.
Jeff Powell, GIS Specialist: I was first exposed to GIS as a freshman in college, watching my biology professor sketch up a map of study areas over an aerial photograph when I had stopped by her office. I was so intrigued seeing these (what seemed at the time) crisp aerial photos of huge areas, my house, and my favorite public lands. As part of a generation who didn’t always have programs like Google Earth at their fingertips, the fresh perspective of seeing landscapes from the sky was exciting and drove me to learn more. That next fall I was in her GIS classroom.
Sarah Morrison, Engineering Technician: I first stumbled across GIS in college when I changed my major to geography and had to take a GIS course. My first class with the program was less than enjoyable due to the teacher not actually knowing GIS. I learned nothing. I also took a cartography elective, and in that class learned that GIS could actually be fun and useful. I proceeded to use it in a few other classes and then at my first job out of school.
Q #2: What is your GIS niche or what do you most often use your skills for?
Scott: I think my niche in GIS is that I really identify with the ‘S’ in those three letters. Geospatial systems are comprised of the applications and data we use, but also the problems we want to solve and the processes we use to solve them. This system, like others, has its own set of rules, and as Morpheus said in The Matrix, “Some rules can be bent, others can be broken.” I believe we can ask better questions and solve complex problems when we push the rules of GIS past their boundaries.
Amber: I am a scientist at heart, and after years of working with engineers, I’ve absorbed a lot of their thinking as well! I create GIS analytical tools and/or datasets, most often related to water resources. Cartography is also one of my passions–creating a visual image that relays complex information is always an exciting challenge, and allows me to delve into the more artistic side of GIS.
Zach: As a part of the environmental team, I am the main source of map creation for environmental reports and other environmental-related GIS tasks.
Todd: I started out in land records development for the first 20 years of my career with a background in survey, aerial photography and real estate data. In the last 10 years it has moved towards more municipal work, with an eye towards asset management systems for municipalities. My understanding of the construction and mechanics provides me some good insight into the daily operations of public works and utilities.
Courtney: I use GIS all the time to bring aerials or other data into our engineering designs and to create exhibits for marketing and proposals.
Jeff: I specialize in developing solutions using web GIS, which typically involves listening to clients discuss their management vision for public utilities, increasing public engagement through technology, or an upcoming special project then develop data and GIS web applications which staff can use to organize, collect, analyze, and report on those tasks throughout their lifecycle. I enjoy the problem solving, turning a technical challenge into a simple GIS solution for users to achieve what they want with a few clicks or taps.
Sarah: Most of my time in GIS is split between cartography based planning studies (especially housing studies and comprehensive plans), stormwater analysis — where I handle more data than actual map creation — and wetland delineations, which are a bit of both!
Q #3: What’s the best application of a GIS map or tool you’ve used or seen someone else use?
Scott: There have been so many lately. Obviously, the John’s Hopkins COVID app has made GIS dashboards a household word. A lot has been done recently to identify racial inequity and the effects of climate change. I think some very important GIS work is just getting started. With this being a census year, the effort to re-draw voting district boundaries will soon follow. I believe GIS provides the best tools to ensure those boundaries are drawn in the most unbiased ways and ensure every vote counts equally. The GIS Lounge website recently posted an interesting article on using Spatial Methods to Combat Gerrymandering After the 2020 U.S. Census.
Amber: As an avid runner, I love seeing GIS used for recreational exercise (think STRAVA). I can find new running routes, track my own goals and get in touch with my fellow runner friends. A more somber example of GIS excellence is the large-scale adoption of mapping the spread of COVID-19 across the world. Having live data, readily available to decision-makers and the general public, is key to fighting a global pandemic.
Zach: One of the coolest GIS tools I’ve seen is this application by the City of Minneapolis that provides an easy way to see the rooftop solar panel suitability for any building in the city. It provides an estimate of viability in seconds for anyone thinking of installing solar panels on their property.
Todd: In general, ArcGIS Online – Esri’s cloud GIS — has been huge in that it offers a low-cost entry point for communities. Specifically, I really have been impressed with capital planning applications our team has developed. Looking ahead, I think the use of BIM-related data in a GIS system for facilities management like within a wastewater treatment plant or school/campus sites offers some pretty exciting opportunities to come.
Courtney: I would say being able to bring multiple sources of data into one map to help determine design problems/solutions has been my best use of GIS at work.
Jeff: I’ve been really impressed with the growth of the GIS industry towards the direction of public individual use. New products like onX and Waze put pure GIS technology in the hands of people to enrich their hobbies or make better day-to-day decisions.
Sarah: I’ve truly enjoyed working with GIS data to create helpful figures for public reports and studies. Getting the data to play nice and display different things based on queries and symbology is so much fun! However, GIS’s capabilities are so much greater. I think one of the coolest tools I’ve seen in action is Amber’s (Amber Converse) stormwater tool that is meant to help municipalities plan where to locate facilities to handle new or planned development.
Q #4: What’s the biggest misconception about GIS?
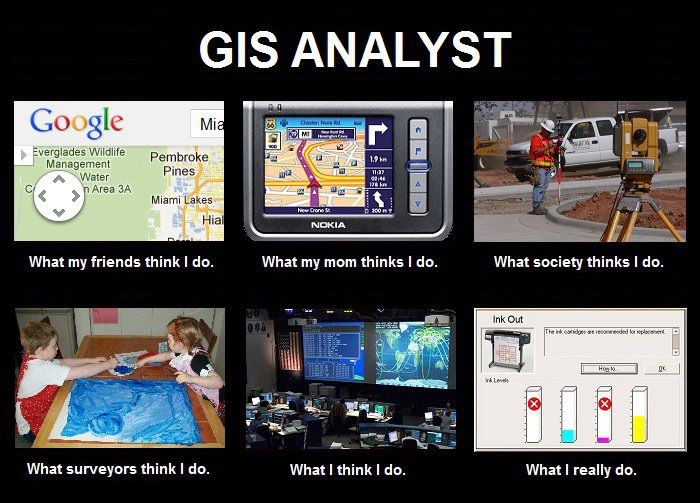
GIS Analyst meme shared by Blue Sky GIS.
Scott: This! A great meme shown to the right, shared by Blue Sky GIS.
Amber: Many people only think of mapping in the traditional sense – like a paper road map used to drive across the county. But GIS can be applied to nearly every discipline from agricultural land management to epidemiology to urban forestry. Name a topic, and I can almost always think of a use for GIS!
Zach: The biggest misconception is that GIS can only be used for static maps. GIS can also be a great tool for web applications, dashboards, public presentations and data analysis.
Todd: That the software will cure all issues, when in reality, it requires full adoption by the users to embrace the change in process that automation will bring. Many times, existing workflows are not sufficient to take advantage of GIS technology and need to be adjusted.
Courtney: That only us “GIS” folks can use it. GIS can be used and applied all around us and even by those who think they have no knowledge or experience in GIS.
Jeff: That it is a specialized software for a niche group of people. It might take a GIS specialist to recognize, but I see GIS fingerprints everywhere I go. Even if an end product like a billboard, a news story, or mainstream web tool doesn’t contain a map, spatial analysis and GIS often played a role in that item’s creation. GIS is for everyone’s benefit and there are various applications and tools for every skill level of user, especially those with “no skills.”
Sarah: That its main purpose is making maps for people to look at!
Q #5: What’s a good first step in the door for communities who want to implement GIS?
Scott: The simple first step is typically to collect spatially accurate data. Starting with good data is the best way to get the snowball rolling. For example, it allows you to grow your GIS from simply knowing where your assets lie to modeling how small changes affect your entire sewer system.
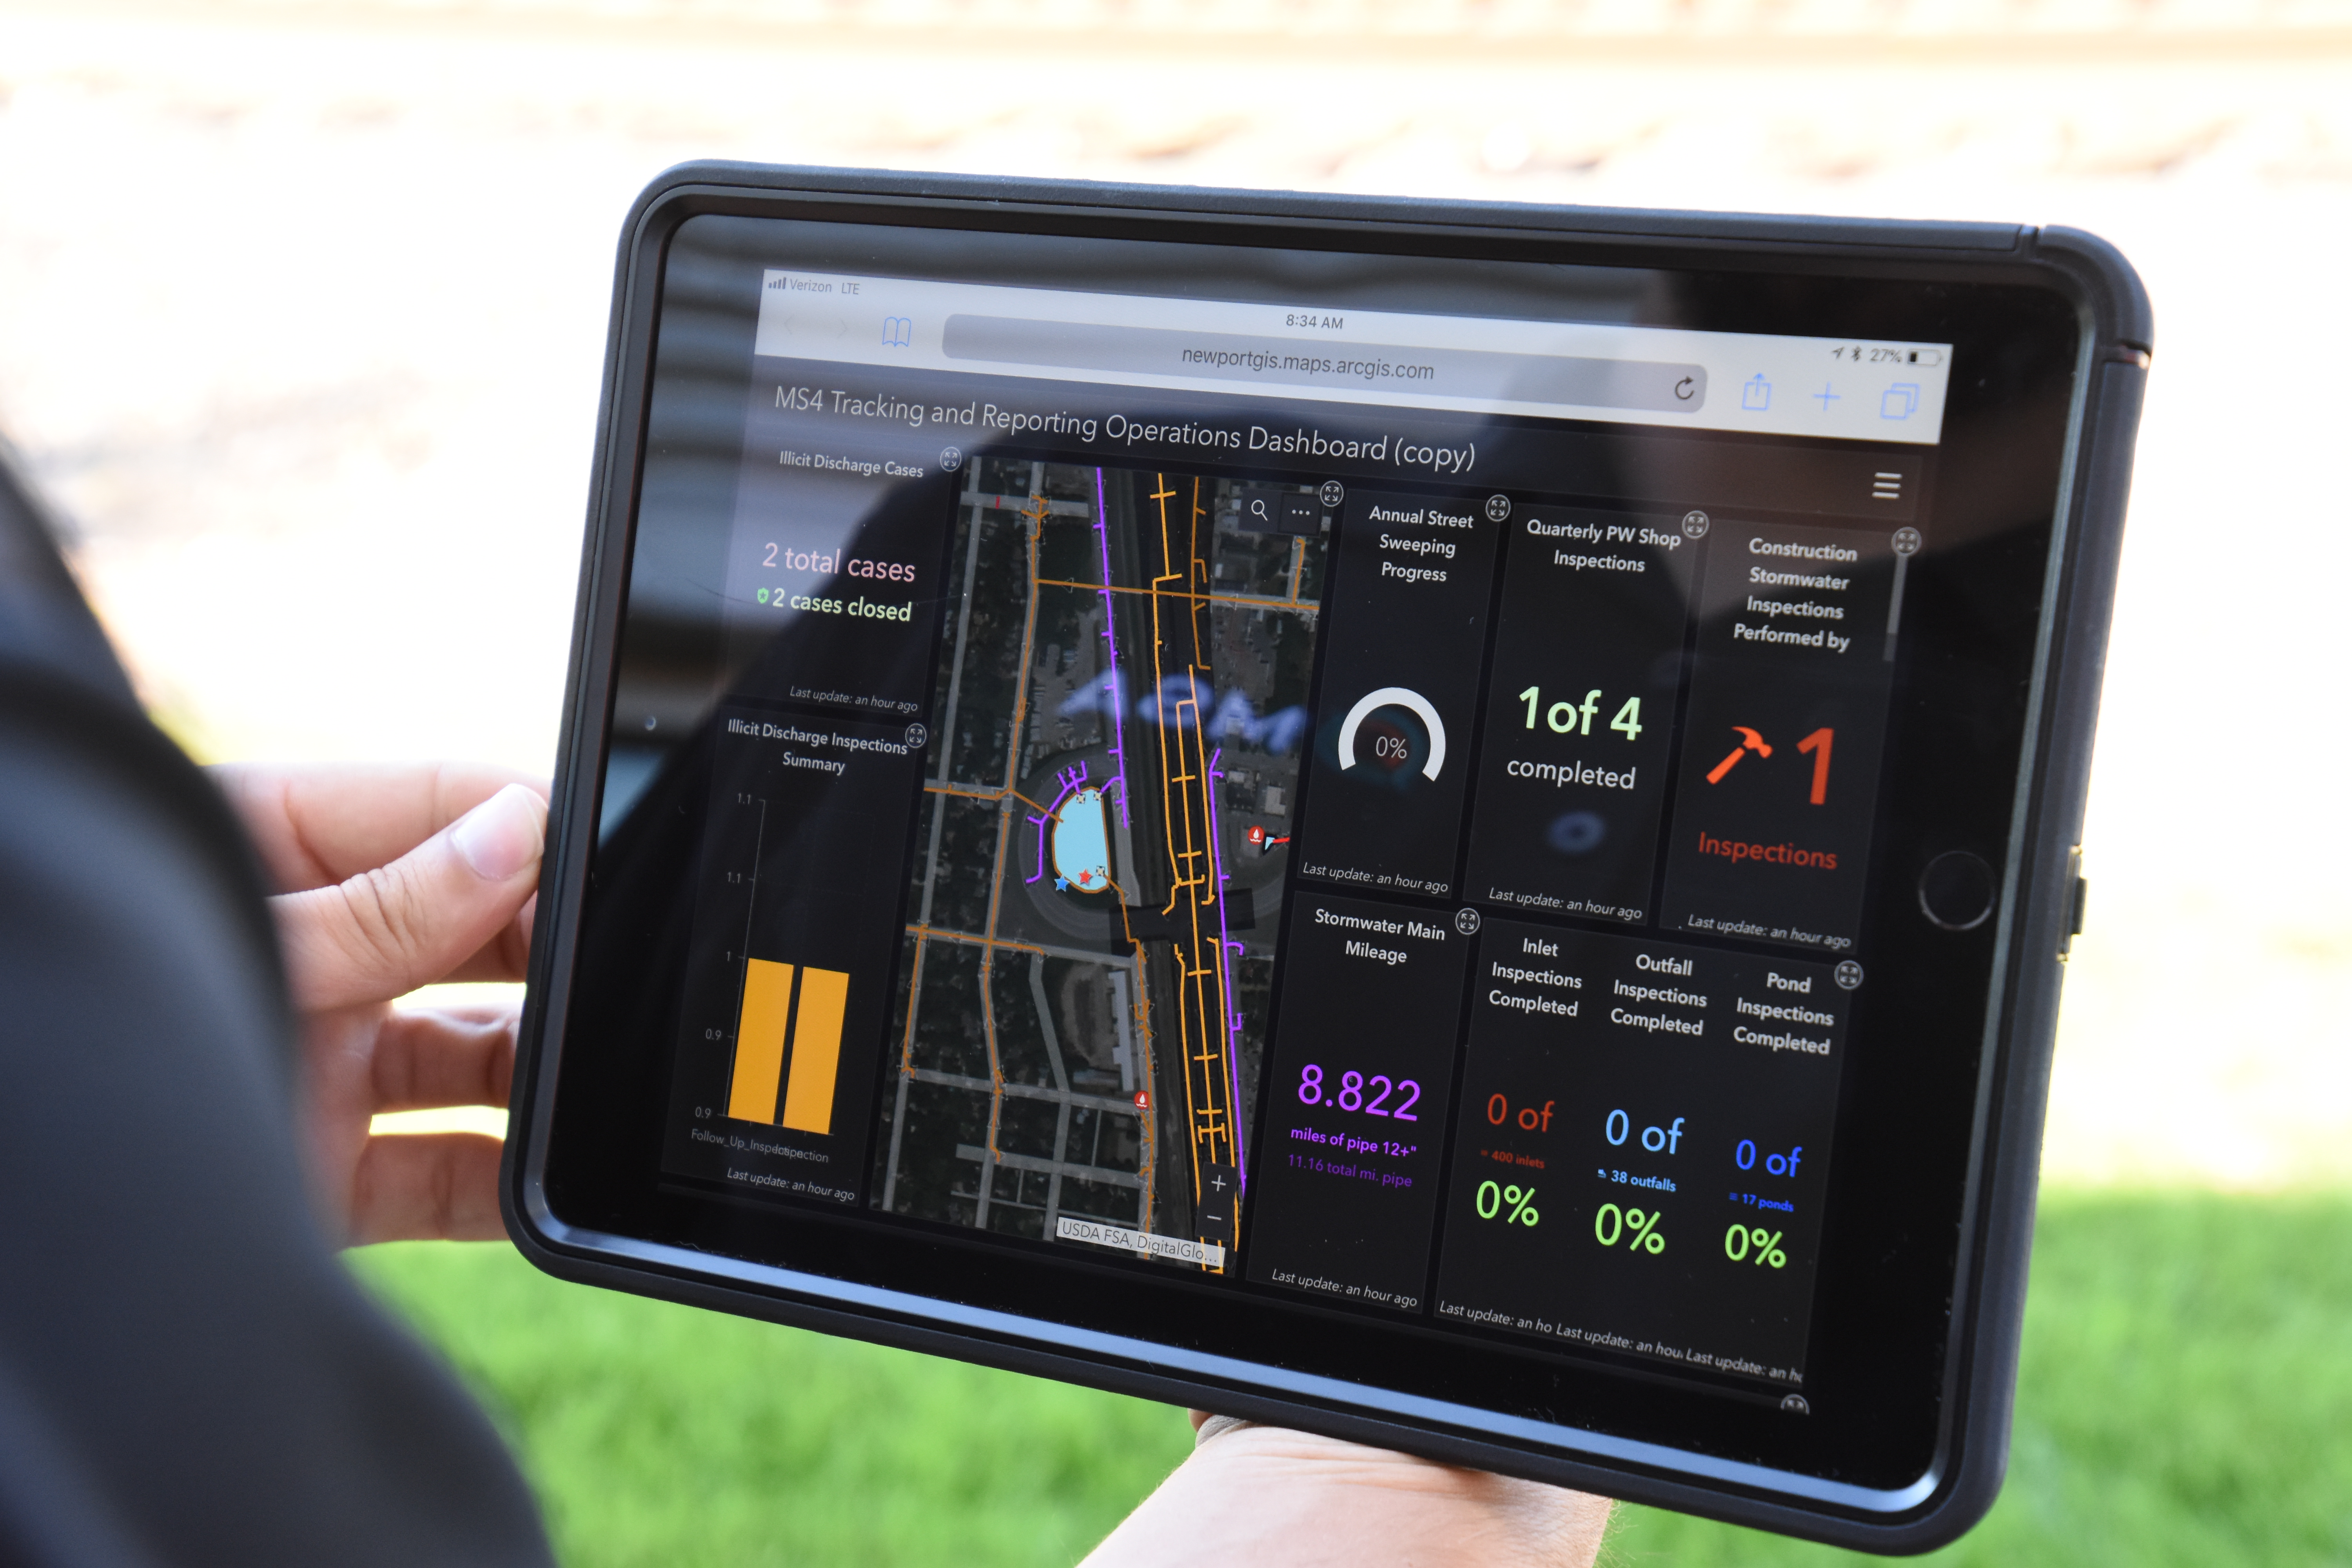
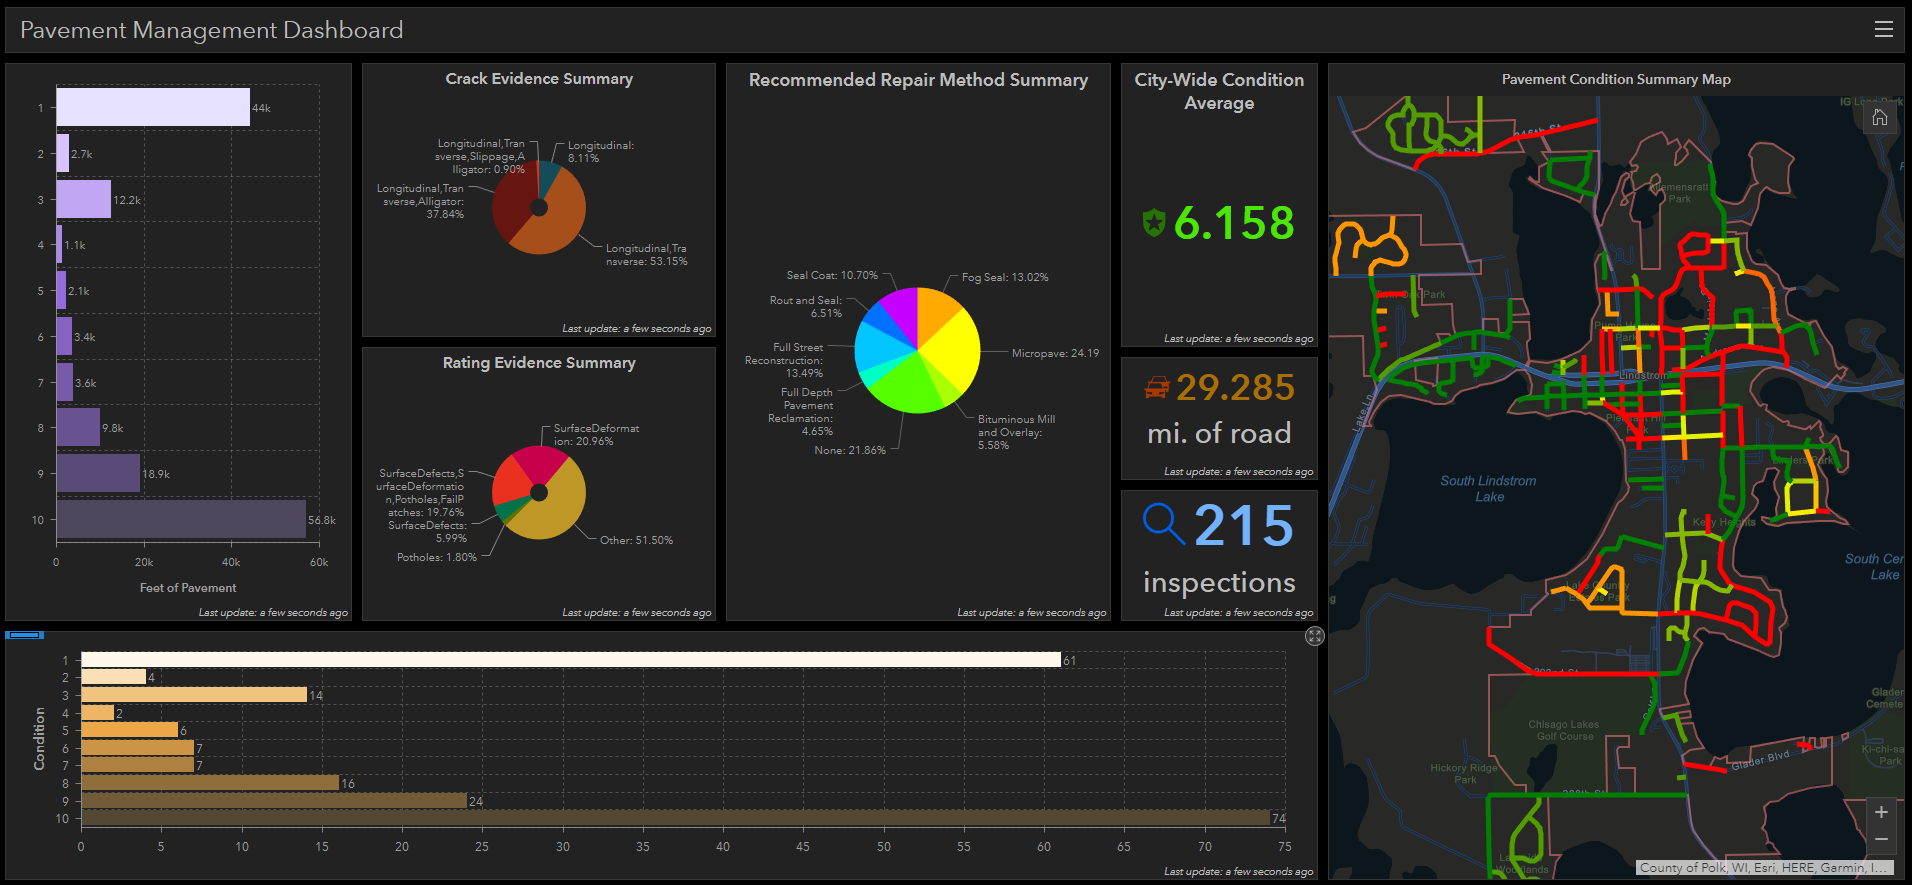
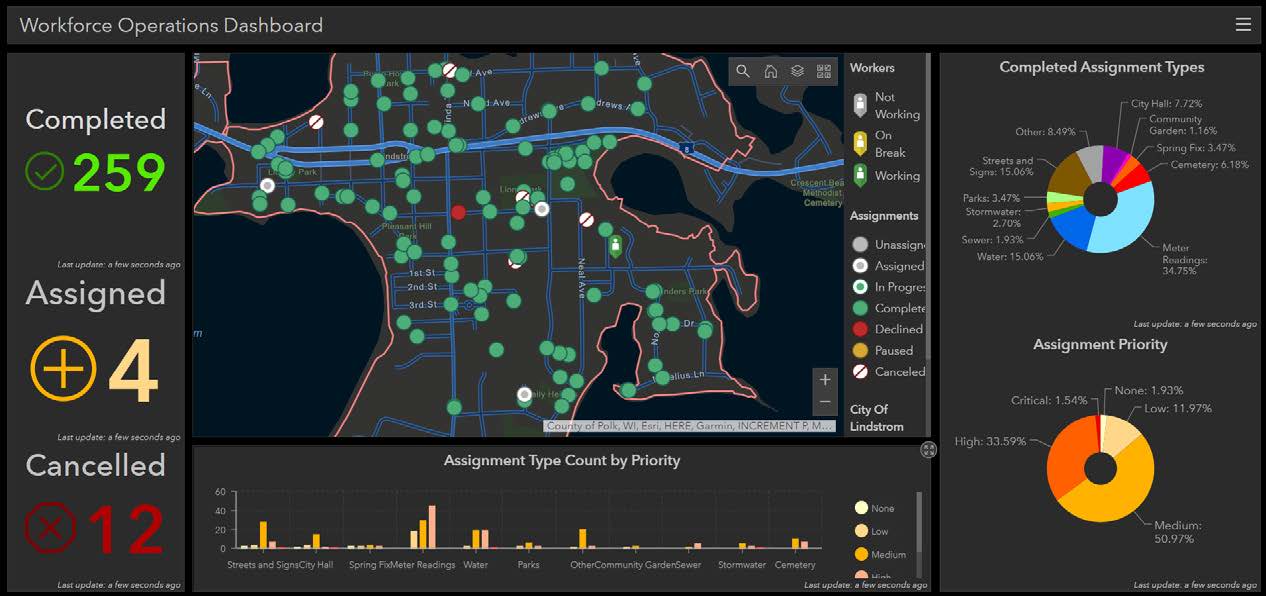
Mobile work orders and operations dashboards allow staff to easily track inspection and maintenance efforts.
Amber: First, think about what challenges or hurdles you might want to take on with GIS. Then, make note of what information you have already. Data gathering is always a first step in developing a GIS system. It can be time consuming, but you can leverage all your datasets, be it paper documents or historical knowledge of your staff.
Zach: I would say a good first step is outlining ideas of where GIS can be used in your community. GIS can be used for many different things but finding what tools would benefit a community the most is important.
Todd: Have both short- and long-term goals identified. Revisit them annually and adjust as needed with your annual budget. Also, identify a champion who can shepherd your projects ahead. That person needs to understand the goals as well as the processes required to get there, including a sense of the costs.
Courtney: Asset managers. Find something the community is tracking or wants to track and GIS can help with that.
Jeff: Get started building digital maps and getting them into web GIS if they have not already. Most of the utilities in the ground are 30+ years old. With every year that passes, the fine detail of those systems’ construction is buried deeper in a file cabinet or lost through staff succession. The time is now to start catching up to filing those critical details in an accessible and user-friendly format. The barrier to entry into GIS is relatively low, so getting information out of the dark and into daily use is the most important step a community can make. A first step is to have MSA review the various types of information a community has across all departments and make recommendations on how best to migrate that into a simple web platform! Subsequent to that, the growth and capability of a community’s GIS is up to them, and at their own pace.
Sarah: Start cataloguing data in a way that is easy to understand and consistent.
Q #6: What might be one of the most beneficial GIS investments a community could make right now?
Scott: Communities can make a simple investment to embrace a mindset that new ways of doing things will have positive long-term impacts. The best part is, this investment won’t cost them a thing.
Amber: There are many different avenues for GIS in communities, and developing a game-plan for what to tackle first is a great investment. Think through what you want to have in your GIS system and then make a timeline for implementation. You don’t need to do everything today, but having a schedule written out can garnish more support and buy-in from your residents.
Zach: The biggest and most beneficial investment to any GIS system is gathering and inputting as much data as possible. Whatever a community would like to track (utility systems, road conditions, tree surveys, etc.) the more data that is input, the more accurate and useful the analysis can be.
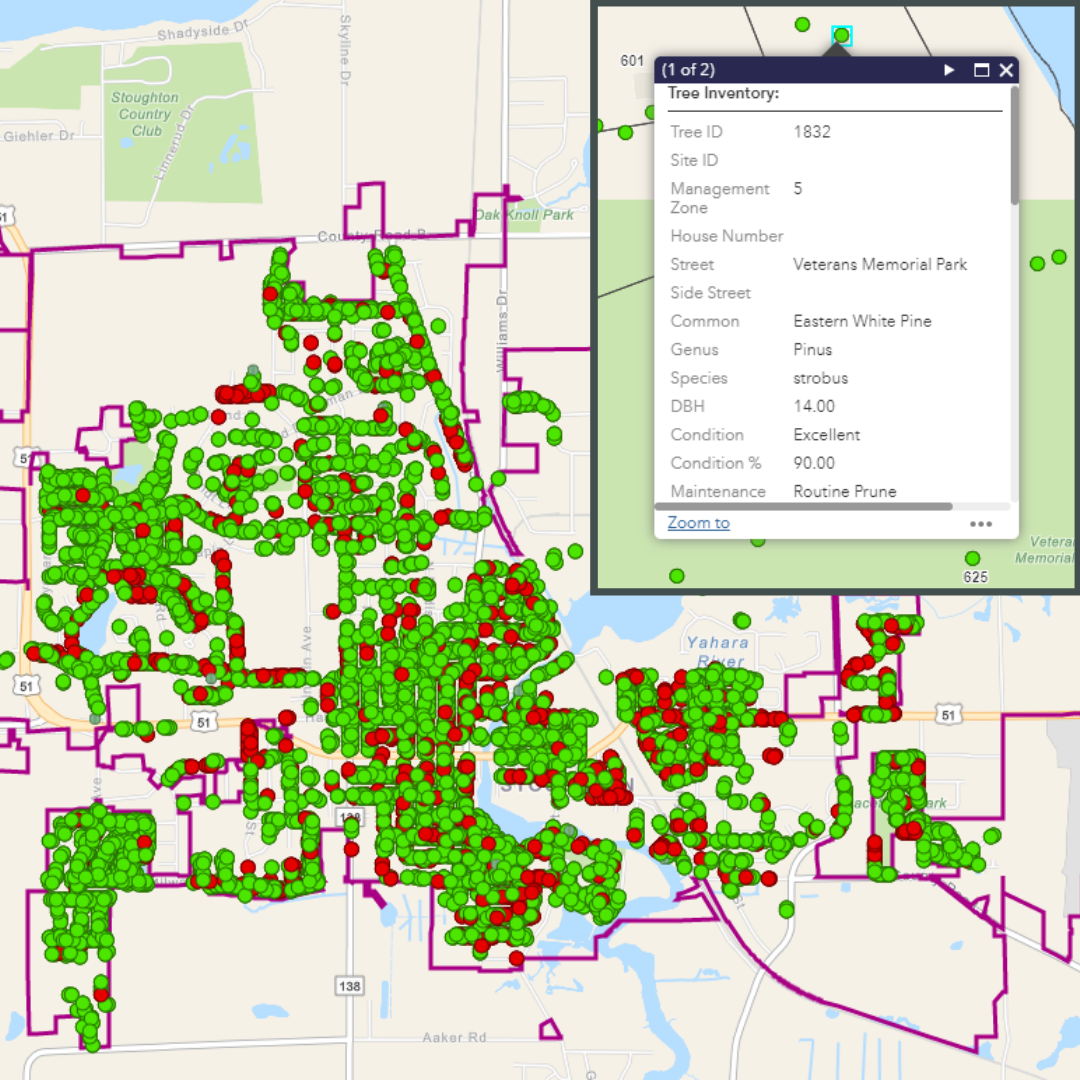
Urban forestry management – using GIS for tree inventory and maintenance.
Todd: One question we get is, “How much accuracy will we need?” Many view this from having access to a digital map as the main goal. Going back to the long-term goals, we are finding the need for elevation data in GIS to support modeling, locates and planning. My advice is to be aware of these future needs and maybe pay more for quality GPS if you can afford to. Your investment will last longer and have more uses in support of these needs.
Courtney: AGO. Having an ArcGIS Online account will open the door to leveraging GIS in the community.
Jeff: A beneficial investment in GIS is an investment in a community’s active priorities. While GIS tech has a cutting edge tool for just about every sliver of community management, focusing on the current community headaches or special initiatives and applying GIS to help make that process easier to collect, create, store, or analyze is often the most efficient and satisfying feel-good approach for a community. Some great recent examples from MSA clients are a 7-year phased sump pump inspection program, neighborhood assessments, new permitting process for homeowners in certain zones desiring property modifications, and going in-house with previously contracted inspections such as cross-connection control.
Sarah: I’ve found that the most frustrating part of working with different community data is that things are often coded incorrectly or inconsistently. For example, one city might have outlets coded in their system as “Outlets,” “outlets,” “OUTLETS,” “Out lets,” and “Stormwater Outlets.” With data, consistency and common naming conventions are key, and I think establishing a system early on in their process could be extremely helpful.
Q #7: Is there anything specific in response to the COVID-19 pandemic that you think GIS can help solve or streamline?
Scott: As I mentioned earlier, GIS is being widely used to identify COVID-19’s spread and current infection rates, but it’s also a great way to help us move forward. There are GIS tools to help communities and businesses develop safe reopening plans. I think its most important use will be to support the equitable distribution of a COVID vaccine.
Amber: Having your data available in an online format is key right now. Many individuals are working from home, with limited access to local servers. Data that is hosted in the cloud will allow your staff to have consistent access to their geographic data and help them continue to work efficiently during this time of uncertainty.
Zach: I think we have seen dashboards become a very important tool for presenting COVID-19 data to the public. The flexibility and interactivity, along with the ability to update in real-time, have led many municipalities to use dashboards to present COVID-19 maps, tables, graphs and trends.
Todd: Many have seen the John Hopkins Hospital’s GIS-based Dashboard that provides a lot of statistical analysis on COVID-19 case rates, and now there are county and state-based applications as well. In a sense, these are based on infection rates and other statistics designed to inform us about the spread of this disease. I think these same apps should also give us the statistics to provide a more realistic level of confidence in the overall population infection and recovery rates so that we don’t add more panic to the situation.
Jeff: GIS entered this scene as soon as the first few cases were documented in the United States. The largest benefit GIS provided here was a central place to manage all the rapidly changing data and redistribute it in an understandable way to the public. The flow of information locally traveled to information authorities like Johns Hopkins, who used web GIS to turn around globally reported information every hour. GIS provided an invaluable resource to not only large data authorities, but to government officials of every level, by leveraging and spatially recalculating that central information into their own county boundaries for local reporting. GIS specialists at MSA were able to plug into this clear and accurate data stream to create maps and local statistics for our county clients, while staying connected live to any changes in that data. Just imagine the mess if every authority had been trying to track cases, etc., across hundreds of copies of individual spreadsheets.
All that recent history aside, imagine this process working for your community in a remote, work-from-home environment for all staff members. We have seen many communities transition to a more paperless, contactless method of performing and tracking work and reporting using MSA’s GIS solutions as departments and staff have lacked a great deal of the communication methods and frequency they used to rely on with ease.
Q #8: Where do you see GIS in 10 years?
Scott: Well, if the last 10 years are any indication, GIS will look much different in just the next year, so 10 years will probably be a lot different. I think nearly all the data we use will come from sensors. Things like inspections with 3D scanners will only increase. Eventually, most sensors will report conditions in real-time. I could see garbage trucks, plows and other city vehicles all mounted with scanning equipment and report-required maintenance while those vehicles are performing their daily routines.
Amber: GIS is growing and adapting at an amazing pace! Just 15 years ago, I was shocked by the ability to see a live map on my phone and now it’s considered an essential part of daily life. I anticipate this growth will continue into the future, with widespread adoption of GIS data to drive decision-making. Smart planning, like identifying when infrastructure is likely to fail, and crafting budgets appropriately, will allow communities to be proactive rather than reactive in repairing aging infrastructure. Large communities are already doing this, and smaller communities will be able to follow suit, adopting similar methodologies tailored to their needs. Integrating crowdsourced data will also be more commonplace, using big data to identify trends and inform the public.
Zach: I see GIS growing as a tool for data analysis in the next 10 years. As we continue to track more and more data electronically, data science and data analysis will become more and more important. GIS can be a very beneficial tool in this sector, using spatial analysis to better understand how data interacts with our physical world.
Todd: The integration of BIM into GIS will provide a better and more detailed entry into indoor and facilities GIS. Our systems will be more detailed than ever and the advent of 5G will facilitate the use of mobile GIS indoors as well.
Courtney: Everywhere. The world is constantly spatially tracking things from weather, health, economy, social activity, etc.…and that all has a GIS element to it.
Sarah: I think GIS will be a much more common tool in the next 10 years, especially with the rise of smart technology and self-driving cars. I also hope they find a way to make it work better with CAD data because it is currently less than ideal.
Jeff: It’s hard to imagine the capabilities in 5 years even, as GIS is growing so fast! I see GIS becoming a common tool that any manager or field-oriented individual is already familiar with as the technology percolates many industries. Sensors, the quality of data, the speed of data, and the size of data is improving and distributed better and faster each year, which opens the doors to easily utilize information for better decision-making. Turning to GIS technology will be a proactive approach, rather than a reactive approach to management. While it might be a staggering pace of growth, we see the ease of use and intuitive interfaces being a big focus of software creators, allowing folks with no exposure breezing through the end-user workflows.
There is so much that GIS can do and so many processes it can help streamline. Whether you’re building your system from scratch or looking to unlock your existing system’s greatest potential, MSA’s GIS team is excited to put their ideas and talents to work for you. Ready to get started? Request a personalized demo or contact us today.
