What first comes to mind when you hear the word “dashboard?”
Not long ago, most people would think only of the space in their cars with the speedometer, gas gauge and such. These days, dashboards have become ubiquitous as graphic representations of all types of information. But, what are they exactly? Data visualization pioneer, Stephen Few, provided a definition in his book, “Information Dashboard Design”:
“A dashboard is a visual display of the most important information needed to achieve one or more objectives that has been consolidated on a single computer screen so it can be monitored at a glance.”
In other words, dashboards provide specific information by consolidating a lot of data into easy-to-understand graphic representations. It’s not unlike your car’s dashboard, which takes all the complex information of what’s going on under the hood and displays it in a more digestible way. MSA uses dashboards to help communities gain better insight from their asset management data.
Enter, GIS
Communities can use GIS to map sewer, water and other critical infrastructure, then use mobile technology to enter information about related ongoing maintenance and inspection tasks. Tracking these operations creates an immense amount of data that’s difficult to sift through even with tools to query and filter it. This is where the “objectives” portion of Stephen Few’s definition comes in.
Many communities’ objectives pertaining to the management of their infrastructure are similar to the following:
- Determine how much work has been completed
- Determine how the work affects the infrastructure
- Identify areas where assets need major repair or replacement
The information gleaned by meeting these objectives helps communities make the most comprehensive and informed decisions about when and where to use their budget dollars. In addition, the development of a custom dashboards — for elements like sanitary or water systems, for example — can aggregate operational data into simple graphic representations that meet the specific reporting requirements of state agencies such as the DNR and the Public Service Commission.
Dashboards at work: Rice Lake Utilities – Rice Lake, Wisconsin
MSA configured dashboards for Rice Lake Utilities (RLU) to gain detailed insight into their sanitary and water operations.
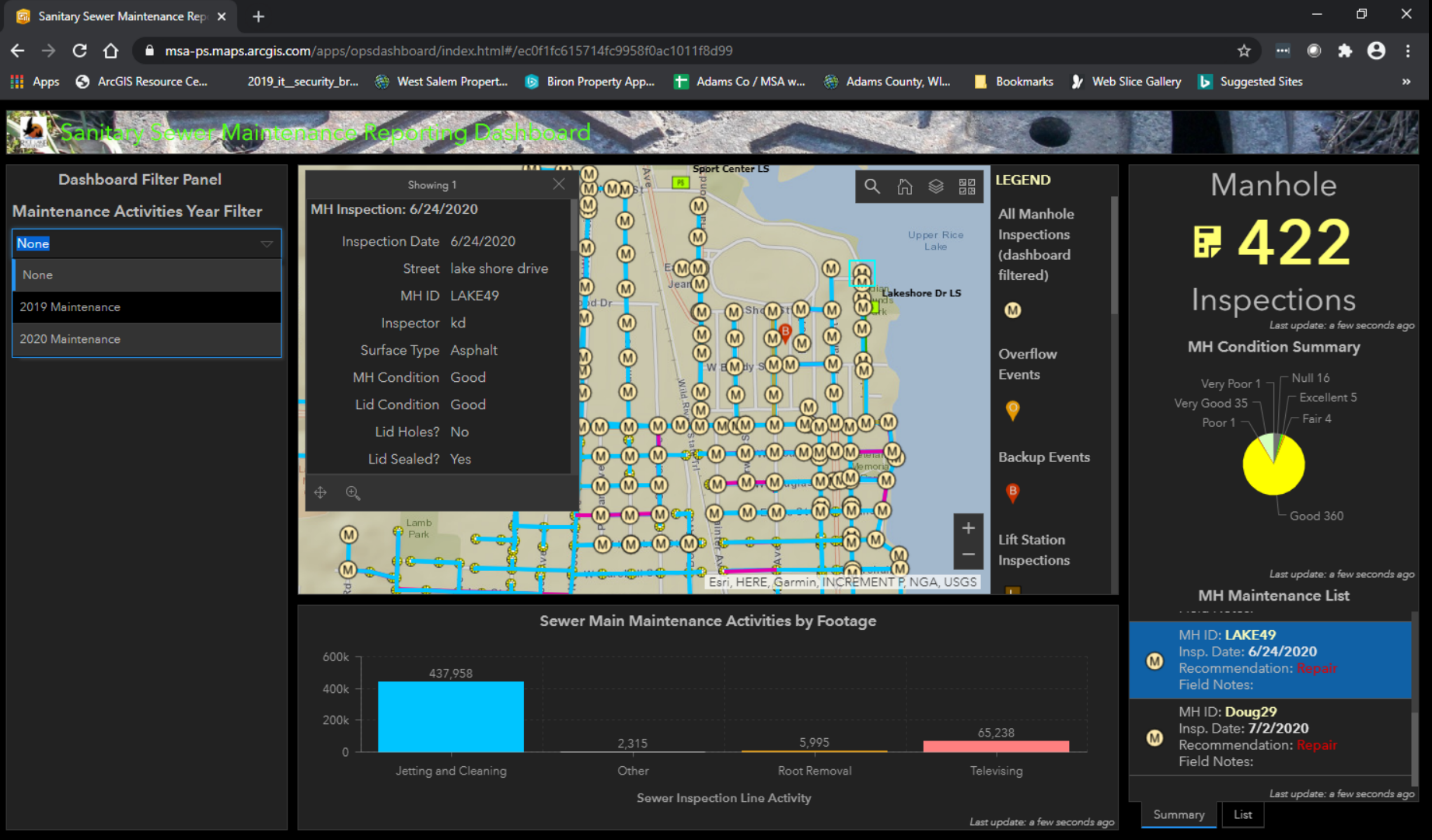
The Sanitary Sewer Maintenance Reporting Dashboard shows RLU which manholes have been inspected and highlights those flagged to need repair. It also shows which sewer mains have had maintenance and totals the number of feet per various types of maintenance performed (cleaning, root removal, televising, etc.). Sewer back-ups and lift station inspections are highlighted on the dashboard as well.

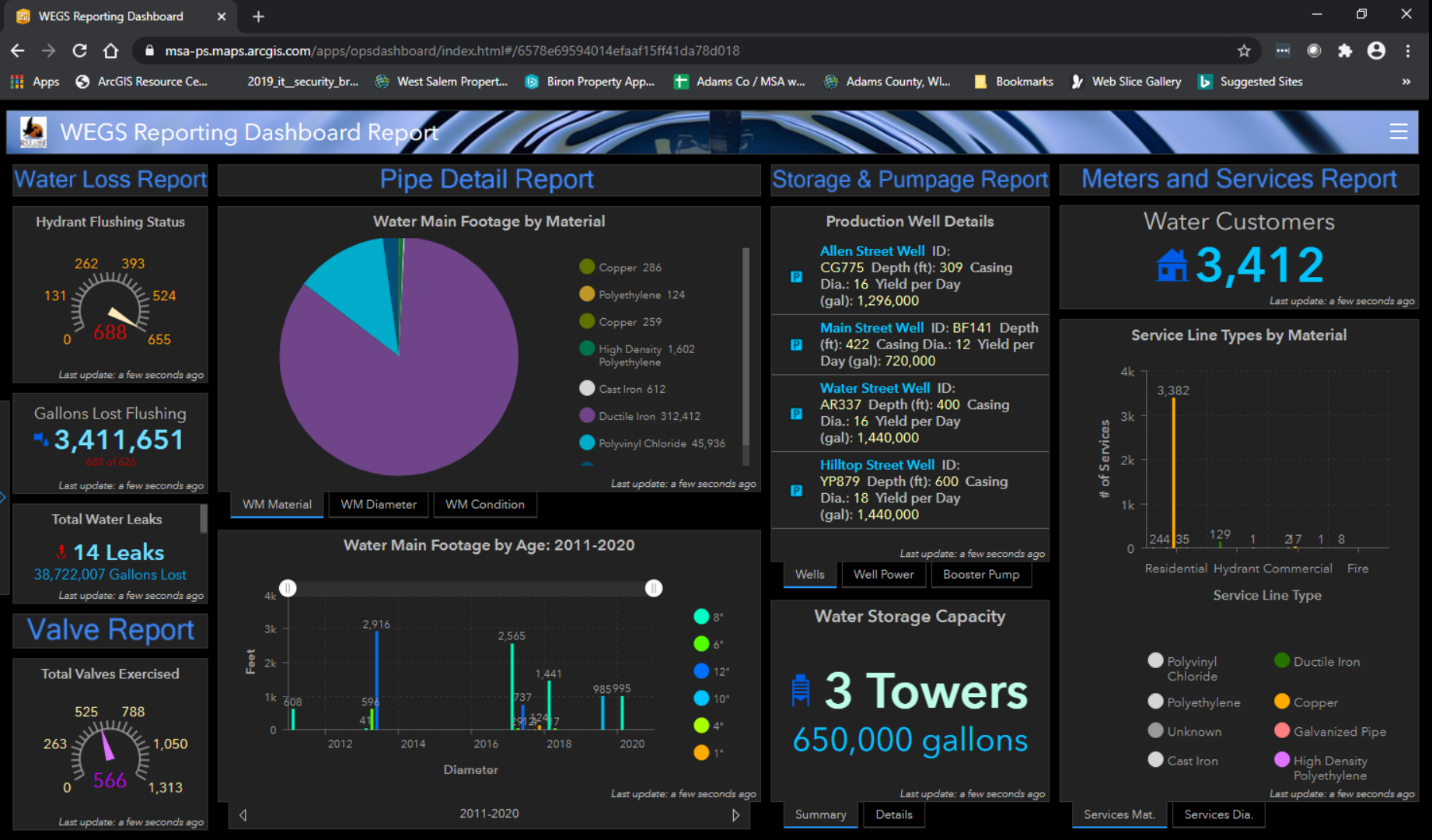
RLU uses a separate Water Reporting Dashboard to understand every detail about its water distribution system. The dashboard shows maintenance information about how many valves were exercised, how many hydrants were flushed and how many leaks were identified, as well as how much water was lost due to flushing and leaks. Charts show the total footages of water main aggregated by material, size, condition and the year it was installed. RLU can review immediate details about wells, pumps and storage towers. The dashboard also shows the current number of customers it serves with a live meter count and charts that show the material and size of the lines serving those customers.
RLU can filter all results on both dashboards by the year each maintenance task was performed or can choose their own date range. The dashboards are interactive, allowing users to click on various infographics, to modify other infographics based on that selection, or to delve deeper into the specific information at hand. Overall, the dashboards provide RLU with at-your-fingertips detailed insights condensed down from a large amount of data.

MSA – your asset management partner
In addition to dashboards for critical municipal utilities and infrastructure, MSA custom-configures dashboards for communities to report on pavement condition and management, capital improvement projects, work orders, tree and sign maintenance, to name a few. There are many opportunities for using dashboards to better understand the masses of information in asset management systems. Community infrastructure and the data needed to manage it continues to grow in scale and complexity. Thus, a need to truly make sense of the data.
MSA can configure dashboards that are specific to a wide array of municipal operations, providing clear, logical insight to keep any community’s engine running at peak efficiency.
