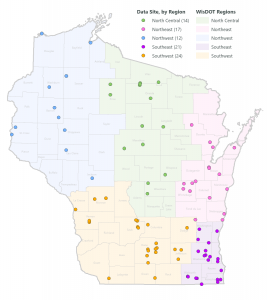
Seeing a need for more accurate trip generation data in the Midwest, the Wisconsin Department of Transportation’s (WisDOT) Bureau of Traffic Operations (BTO) asked MSA to collect trip generation data from 88 unique convenience stores/gas stations across all five WisDOT regions. Locations ranged from Superior in the far northwestern part of the state to Kenosha on the far southeastern edge along Lake Michigan. The purpose of the study was to determine real-use data about vehicular trips to and from each location, which would set the foundation for new trip generation rates for the future development of these entities across Wisconsin.

Sites were selected by WisDOT’s Traffic Impact Analysis Users’ Group and regional traffic staff, based on land use characteristics as defined by the Institute of Transportation Engineers (ITE) Trip Generation Manual, 10th Edition. Locations were also required to meet several eligibility requirements: they must have at least six vehicle fueling positions (pumps); rural areas should have a population of less than 5,000 and urban areas more than 5,000; tourism areas must have a summer average daily traffic count of 50% or more than the respective off-peak season; freeway locations were to be located within 0.5 miles of an interchange; and sites containing auxiliary uses such as fast food counters, diners, coffee shops, or bakeries were to be excluded. In total, MSA staff would comprehensively study 14 locations in the north-central region, 17 in the northeast, 12 in the northwest, 21 in the southeast and 24 in the southwest. The resulting 88 sites were selected to represent a balance of freeway and non-freeway locations as well as tourist and non-tourist areas, in both rural and urban locales.

Trip generation data collection was conducted for 12-hour periods, 6:00 a.m. to 6:00 p.m. on weekdays, between June 2021 and May 2022. Additional data was collected during Friday and Saturday peak periods for sites located in areas with tourist classifications to capture tourist travel influence. All inbound and outbound trip data was collected via portable video camera units. Sites with multiple access points required several cameras to be set up. After collection, the majority of the data was processed by Miovision’s data processing platform to establish the final number of trips generated per site. A select number of sites were processed and verified manually, due to unique camera angles or other site constraints.
In the end, the data collected allowed WisDOT and its Traffic Impact Analysis Users’ Group to gauge what level of activity each store was experiencing — by whom, and at what times. MSA’s State of Wisconsin Convenience Store/Gas Station Trip Generation Study, published in September of 2022, provides 186 pages of detailed information about project methodologies and findings including data aggregation, reductions, analyses, statewide rates and recommendations for use — along with charts, figures and data comparisons by store/station across regions, by size, classification, study times, deviation percentages, and detailed site-specific studies at each of the 88 locations.
MSA’s study is now being used by traffic engineers across the state of Wisconsin and has been submitted to the Institute of Transportation Engineers to be included in the database for the calculation of national rates as well. This data helps traffic engineers make more accurate trip generation forecasts to aid in determining future infrastructure needs.
